The World Population Pyramid, Growth Rate, and Population Growth (1950-2100)
The article World Population Growth, by Max Roser and Esteban Ortiz-Ospina, was published by OurWorldInData in 2013 and updated April, 2017. It contains a multitude of graphs along with discussion of how changing world fertility is affecting overall world population.
First, it should be noted that world population consists of the summed population of every country. Population and fertility are not uniform across countries. Some countries (notably in Africa) have high fertility rates, while Western countries have low fertility rates - some below the replacement rate of 2.1 children per woman. Yet even with low native-born fertility, mass immigration is driving continued population growth in the United States and Europe.
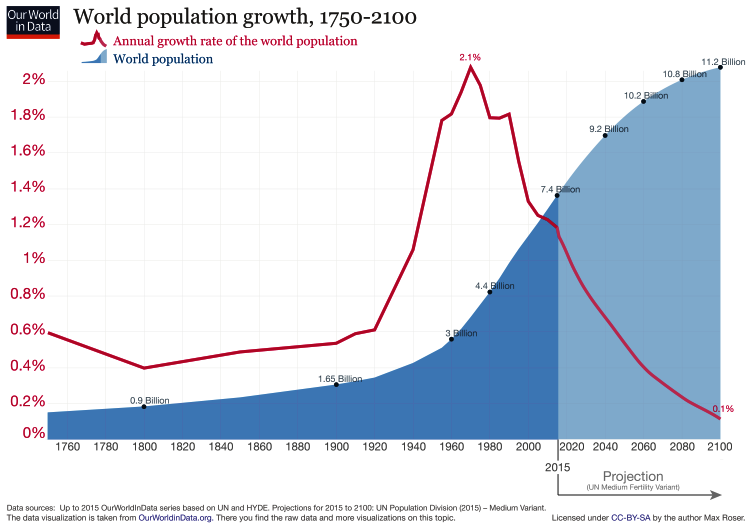
The following graph from the article contrasts world population growth with the annual growth rate from the year 1750 to present, with projections to the year 2100.

Population of all countries combined was 7.4 billion in 2015, and is projected to reach 11.2 billion by the year 2100. That's a staggering increase of 3.8 billion more people - a 51% increase over 85 years. Note that world population is projected to continue growing after the year 2100, albeit more slowly.
The superimposed growth rate shows a peak growth rate for all countries of 2.1% in approximately 1970, with a fairly consistent decline to the year 2100. It can be seen that a reduction in growth rate is required before a significant change in population numbers.
The reason that population numbers lags changes in population growth rate is because of population momentum. Population momentum is the tendency for population growth to continue beyond the time that replacement-level fertility has been achieved because of the relatively high concentration of people in the childbearing years. It takes a period of time equal to the average life expectancy (approximately three generations or 73 years in the U.S.) for a reduction in fertility to be manifested as a change in actual population numbers.
The article states:
Based on these observations, world history can be divided into three periods marked by distinct trends in population growth. The first period, pre-modernity, was a very long age of very slow population growth. The second period, beginning with the onset of modernity—which was characterized by rising standards of living and improving health—had an increasing growth rate that continued to rise through 1962. Today, the second period is over, and the third period is unfolding; the population growth rate is falling and will likely continue to fall, leading to an end of population growth towards the end of this century.
Again, this is not a rosy picture. All countries combined will have to accommodate 51% more people this century.
The entire article is worth reading, as it contains a multitude of charts and graphs.
Another article presents these data with a slightly different focus, along with interesting graphs: The World Population Pyramid (1950-2100), by Jeff Desjardin, Visual Capitalist, April 29, 2019. The article discusses falling world fertility rates as related to increasing median population age:
| Year | Global Population Size | Median Age |
| 1950 | 2.6 billion | 23.6 years |
| 2018 | 7.6 billion | 30.0 years |
| 2050 | 9.7 billion | 36.1 years |
| 2075 | 10.7 billion | 39.0 years |
| 2100 | 11.2 billion | 41.6 years |
Fertility across all countries is not uniform. The countries in Africa are in a particularly critical situation - see the graphs in the article: World Fertility - The World's Most Important Graph. Current levels of immigration into Europe are but the tip of the iceberg. African and Mideast fertility is driving expansive population growth. As long as the gates of the European Union are open, Europe will serve as a migratory destination, absorbing endless numbers of excess population from other countries. The same is occurring in the United States.
Related
Report: Nigeria’s Rising Population a Ticking Time Bomb, This Day Live, May 2, 2019.
